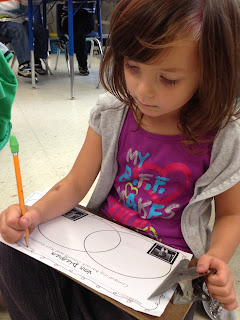
In social studies this week, we have been learning all about the election. Today we studied the two candidates running for President: Barack Obama and Mitt Romney (or as many of the students were calling him, Mint Romney!). We read information about each candidate and created these bubble charts together:
The students took some time to write their favorite facts about each candidate on their own bubble maps.
After we learned about the two candidates, we discussed how a venn diagram can be used to compare characteristics of two people or things. Using a large venn diagram, we played a little game. I read facts to the students and they told me where each fact belonged. They were so into this and really impressed me with how much they had already learned!
Finally , I let the students work with partners on their own venn diagrams. The students used their bubble maps to fill in their graphic organizers.
Have a great weekend!


No comments:
Post a Comment